
Efficient Heart Rate Monitoring
By Sanjeev Kumar, Applications Engineer, Cypress Semiconductor Corp.
Heart rate is one of the most frequently measured parameters of the human body and plays an important role in determining an individual’s health. Heart rate measurement is becoming a part of the typical consumer lifestyle, and many electronic devices such as iPods, exercise equipment, and mobile phones are becoming able to accurately measure heart rate. This functionality, however, does not come without added cost. By using multifunctional devices,developers can reduce the price of introducing new features such as these.
Various methods used to measure heart rate include Electrocardiography, Photoplethysmography, Oscillometry (Blood pressure monitor method ) and Phonocardiography. Each of these methods measures different phenomenon that occur in human body during the heart beat or cardiac cycle to determine heart rate.
Electrocardiographs
The contraction and relaxation of cardiac muscles causes blood to flow in and out of the heart. During each cardiac cycle, a group of tissue in the heart called the sino atrial node (a.k.a., the pacemaker of heart) generates electrical impulses that spread all through the heart and cause rhythmic contraction and relaxation of heart muscles. These electrical impulses can be detected by placing electrodes in specific points in human body. An electrocardiogram (ECG) captures this varying electrical impulse so shows the overall rhythm of the heart.
This method requires placement of two or more electrodes on specific points of the human body. The ECG signal is characterized by six peaks and valleys labeled with successive letters of the alphabet: P, Q, R, S, T, and U (see Figure 1). The P-peak is produced by muscle contraction of the atria. The R-peak shows the ending of atrial contraction and the beginning of ventricular contraction. Finally, the T-peak marks the ending of a ventricular contraction. The magnitude of the R-peak normally ranges from 0.1 mV to 1.5 mV.
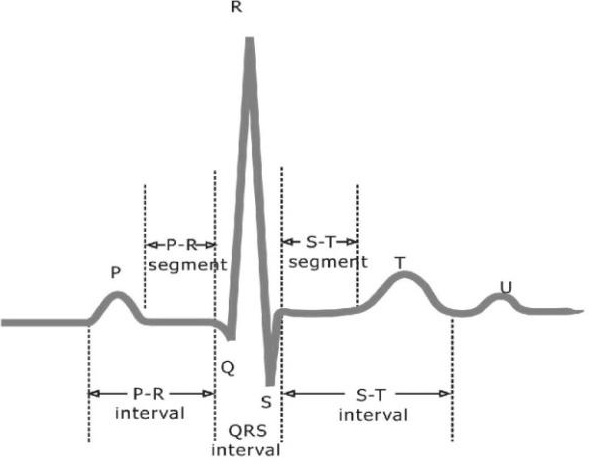
The average heart rate is calculated by first measuring the time interval, denoted RR interval, between two consecutive R peaks and taking the average reciprocal of this value over a fixed window, usually 15, 30 or 60 seconds. This average is then scaled to units of beats per minute (bpm). R-peak is a part of the RQS complex which represents ventricular depolarization. A typical ECG is invariably corrupted by (i) electrical interference from surrounding equipment (e.g. effects of the electrical mains supply), (ii) measurement (or electrode contact) noise, (iii) electromyogram noise (muscle contraction), (iv) movement artifacts, (v) baseline drift and respiratory artifacts and (vi) instrumentation noise (such as artifacts from the analog-to-digital conversion process).
Before calculating the heart rate, we must processing the ECG in the analog (amplification, common mode voltages suppression and filtering) and digital (digital filtering) domains. Most of these functions can be performed by the microcontroller in real time. Figure 2 shows an implementation of a ECG heart rate monitor. The INSAMP rejects the CMRR and the signal is pre-amplified to improve noise immunity. An antiphase signal is also used. This circuit consists of a buffer amplifier (BUF AMP) and an inverting amplifier (INV AMP) that applies an inverted version of the common-mode signal to the hands, with the aim of canceling interference. On the output of this circuit there is a voltage level shift to automatically detect the moment hands are placed on the electrodes. The threshold circuit and comparator detect this moment.
From the output of the INSAMP, the EKG signal passes through a high pass filter and is buffered by the BUF AMP.Then the signal is digitized via an ADC. Later the digitized signal passes through various filters and pulse calculation routines to calculate the heart rate.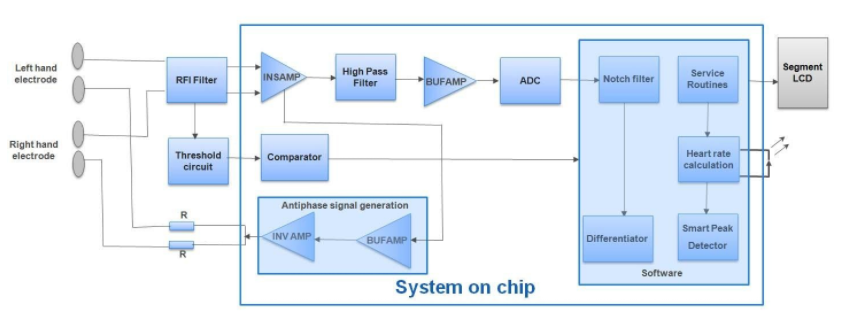
During each cardiac cycle, the blood vessels pulsate in order to carry blood to/from different parts of the human body.When light radiation such as infrared is passed through a blood vessel in a finger or ear lobe, the received light signal from finger/earlobe are periodic and vary due to the rhythmic flow and absorption properties of blood. This optical variation is employed to make Photoplethysmographs.
Photoplethysmography is of two types of transmission and reflection based on the place from which the light sensed.In this implementation, an IR LED is excited by a modulated signal to avoid low frequency interference and the received light from finger or ear lobe is sensed by a photodiode which is filtered using a band pass filter with synchronous demodulator which is in sync with the modulator. This is digitized by an ADC and passed throughsoftware filters to shape the pulse. The heart rate is determined using a software peak detector.
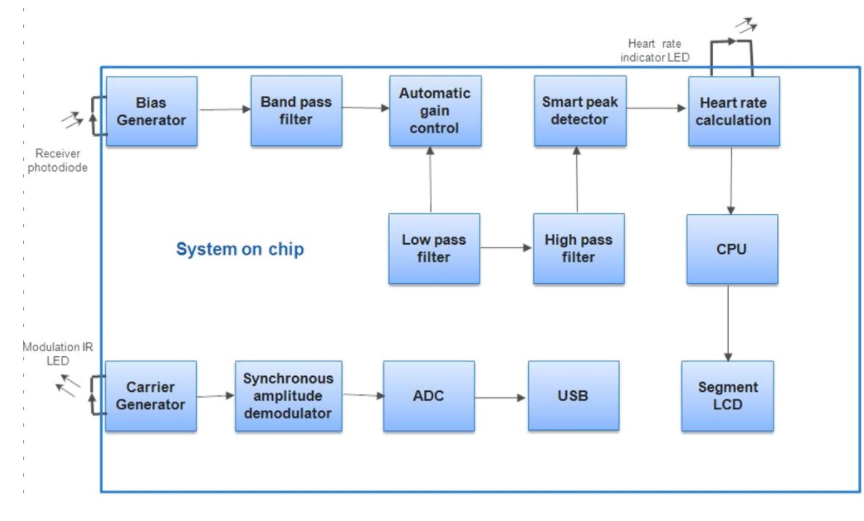
Figure3-Photoplethysmograph
Pressure sensing method
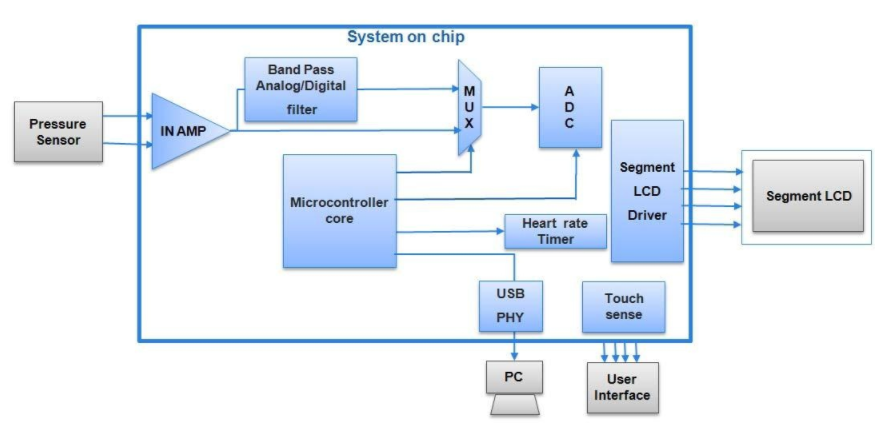
The rhythmic contraction and relaxation of the heart exerts a change in blood pressure along the walls of the blood vessels. As a result, the blood vessels pulsate in rhythm to the beat of the heart. This pulsation of blood vessels can be sensed by pressure or peizo sensors placed at appropriate places on the human body like the wrist. This variation in pressure is used in a blood pressure monitor to measure the heart rate. Figure 4 shows the pulsation of blood vessels in an arm using pressure sensor with filtering and amplification. These pulses are called oscillometric pulses and are measured in automatic blood pressure monitors.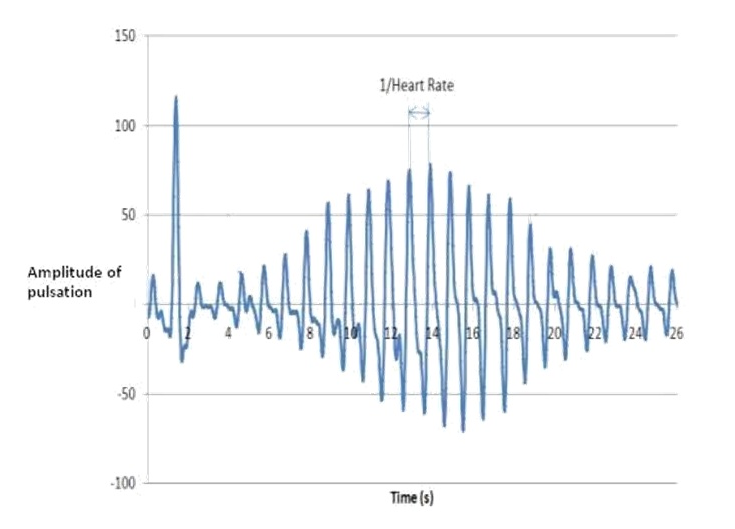
Figure 4-Oscillometric pulses
The pressure signal from the blood vessel is read by a pressure sensor. The signal is later amplified and filtered to separate the heart beat signals. Later the signal is digitized using an ADC. A timer is used as a reference to calculate the heart rate.
Phonocardiograph
The opening and closing of valves in the heart produces sounds during contraction and dilation which is normally audible through a stethoscope. These sounds are rhythmic to heart beat and can be sensed using microphones.Apart from the normal heart sounds (S1 and S2-Lub and Dub), abnormal sounds called murmurs can also be recorded. Normal heart sounds are used to determine the heart rate. The normal heart sounds and different murmurs have different spectral characteristics so with proper filtering the abnormalities of the heart can be visualized. This acoustic property is used in phonocardiographs to determine the heart rate. Figure 6 shows normal and abnormal heart sounds.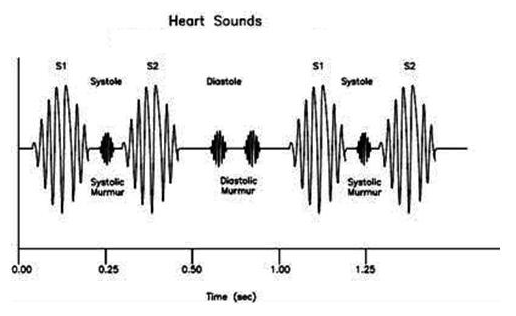
Heart sound signals can be detected using a sensitive microphone connected to the diaphragm. The electrical signals from the microphone are amplified and can be passed through a noise filter to remove external noises. Significant murmurs and rhythmic Lub and Dub sounds can be filtered from the ADC data using digital filters so that the Lub and Dub signals can be used for the heart rate calculation.
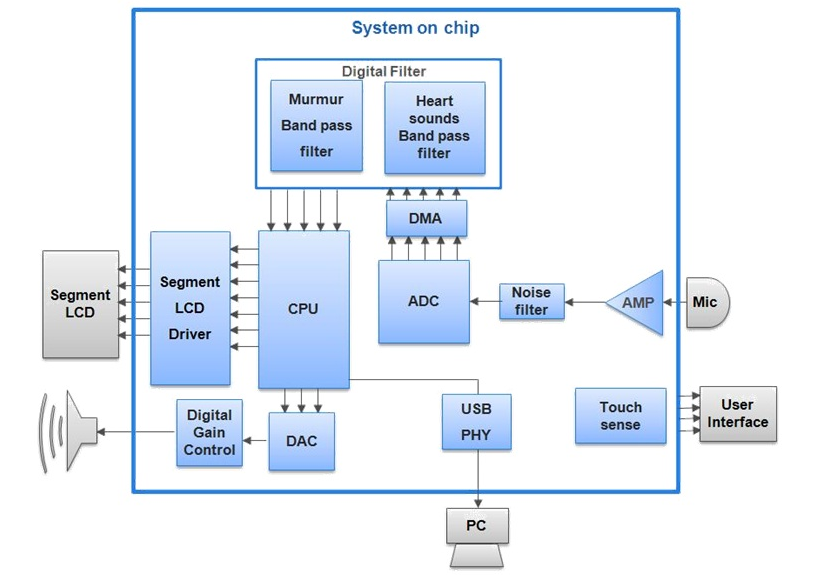
Figure7-Phonocardiograph using a PSoC System on Chip architecture
References
1. AN62651 - PSoC® 3/5 - Blood Pressure Monitor
2. AN2284Sensing - Low-Cost EKG Pulsometer
3. AN2158 Sensing - Optical PulsOmeter with PSoC

0755-82943322

Procure: 2739375490


